
Construction project controls align time, cost, quality and scope by combining baseline control methods such as CPM and EVM with risk-informed forecasting through Monte Carlo simulation and joint confidence levels, backed by reliable field data. Used well, this combination gives teams earlier warning of slippage, more accurate forecasts and a documented basis for corrective action before small variances become expensive ones.
TL;DR:
- Reliable project controls require ownership of data sources, including WBS, schedule updates, and cost reconciliation, to prevent drift and inaccuracies.
- Combining CPM, EVM, and Monte Carlo risk analysis improves early warning, forecasting accuracy, and contingency setting compared to isolated methods.
- Integrating advanced data collection methods like scan-vs-BIM, computer vision, and IoT sensors enhances progress measurement reliability and objectivity.
- Digital twins, Bayesian schedule updating, and AI-driven resource optimization are emerging tools that improve forecast accuracy but depend on high-quality, consistent data.
- Common controls failures stem from fragmented workflows, delayed baselines, poor estimating, and weak governance, which can be mitigated through standardized processes and clear ownership.
Table of Contents
- What do project controls actually cover?
- Core methodologies: CPM, EVM and quantitative risk analysis
- Getting field data right: scan-vs-BIM, computer vision and IoT
- Setting up and running a project controls plan
- Where digital twins, probabilistic scheduling and AI are heading
- Why project controls fail, and how to catch it early
- What this guide means for how we train project controllers
- Build your team’s project controls capability
- FAQ
- Sources
What do project controls actually cover?
Project controls exist to keep a construction project’s scope, schedule, cost, quality and risk pointed at the same target. Each of these elements needs its own baseline and its own artefact, but none of them works in isolation: a schedule slip changes cost exposure, a quality failure changes the schedule, and an unmanaged risk changes both.
Scope starts with the work breakdown structure (WBS), which decomposes the project into manageable packages of work. Pairing the WBS with an organisational breakdown structure (OBS) creates control accounts, the points where cost, schedule and responsibility intersect and where performance is actually measured.
The schedule baseline is built from the critical path method (CPM), producing a logic-driven network of activities, durations and dependencies. This baseline is the reference against which every later update is compared, and it is the artefact that tells you which delays matter and which do not.
The cost baseline takes that same WBS and time-phases the budget across the schedule, producing the performance measurement baseline (PMB). According to AACE guidance, a project controls plan works best when treated as an integrated, quantitative subset of project management rather than a reporting exercise bolted on afterwards.
A functioning controls system needs to produce and maintain:
- A scope baseline with a WBS linked to control accounts and responsible owners.
- A schedule baseline built on CPM logic, with float and critical path clearly identified.
- A cost baseline time-phased against the schedule to form the PMB.
- A live risk register capturing threats and opportunities with owners and triggers.
- Quality checkpoints tied to work packages, not just to overall milestones.
The integration point that most projects underestimate is data ownership. Someone has to own the WBS, someone has to own the schedule update cycle, and someone has to reconcile cost actuals against the PMB on a fixed cadence. Without a named owner for each, the control accounts drift apart even when the individual reports look fine.
Core methodologies: CPM, EVM and quantitative risk analysis
Three methods do most of the work in a mature controls environment, and they are strongest when used together rather than as separate reporting exercises.
- Critical path method (CPM): build the logic network, identify the critical path and total float for every activity, then re-run the schedule at each update to see which activities have eaten into their float.
- Earned value management (EVM): compare planned value (PV), earned value (EV) and actual cost (AC) to produce the cost performance index (CPI) and schedule performance index (SPI), giving an early numeric read on whether the project is ahead or behind its baseline.
- Quantitative risk analysis (QRA): run Monte Carlo simulation against the schedule and cost model to generate a probability distribution of outcomes, then use the joint confidence level (JCL) to set a contingency that reflects combined cost and schedule risk rather than a single-point estimate.
EVM’s real value is in its forecasting cadence. A CPI or SPI below 1.0 flags a problem, but the more useful step is projecting the estimate at completion (EAC) and comparing it against the approved budget on every reporting cycle, not just at milestones. AACE’s EVM guidance ties this back to EIA-748 practices: define the WBS, integrate it with the OBS, time-phase the budget into the PMB, and report consistently against control accounts.
A 2025 study found that integrating BIM with Monte Carlo risk-integrated scheduling reduced mean project duration and produced mean cost savings of approximately 10% compared with deterministic scheduling, when structured mitigations were applied, according to research published in the Asian Journal of Civil Engineering. That gap is the practical argument for QRA over single-point estimating: a deterministic schedule hides the risk that a probabilistic one makes visible.
AACE’s recommended practice on integrated cost and schedule risk analysis describes a hybrid R+EV method, combining estimate ranging for inherent, project-wide risks with expected-value modelling for discrete, project-specific risk events, then running both through Monte Carlo simulation to produce a joint cost and schedule distribution. Getting the split wrong, treating a project-specific risk as inherent ranging or vice versa, is one of the more common ways integrated risk models end up misleading rather than clarifying.
Feeding EVM and QRA outputs into a single forecast means the EAC from earned value and the P50 or P80 outcome from Monte Carlo should be reconciled at every change control cycle, not reported as two unrelated numbers in the same pack.
Getting field data right: scan-vs-BIM, computer vision and IoT
Every controls method above is only as good as the data feeding it. Progress measurement has traditionally relied on site logs and manual percent-complete estimates, both prone to optimism bias and inconsistent judgement calls between supervisors.
Scan-vs-BIM compares laser scan point clouds against the BIM model to measure actual installed quantities against the design baseline. ISPRS research on digital twin construction systems demonstrates that pairing laser scanning with BIM-based schedule updating and discrete-event simulation supports faster progress assessment and reduces the lag between what happens on site and what the schedule reflects.
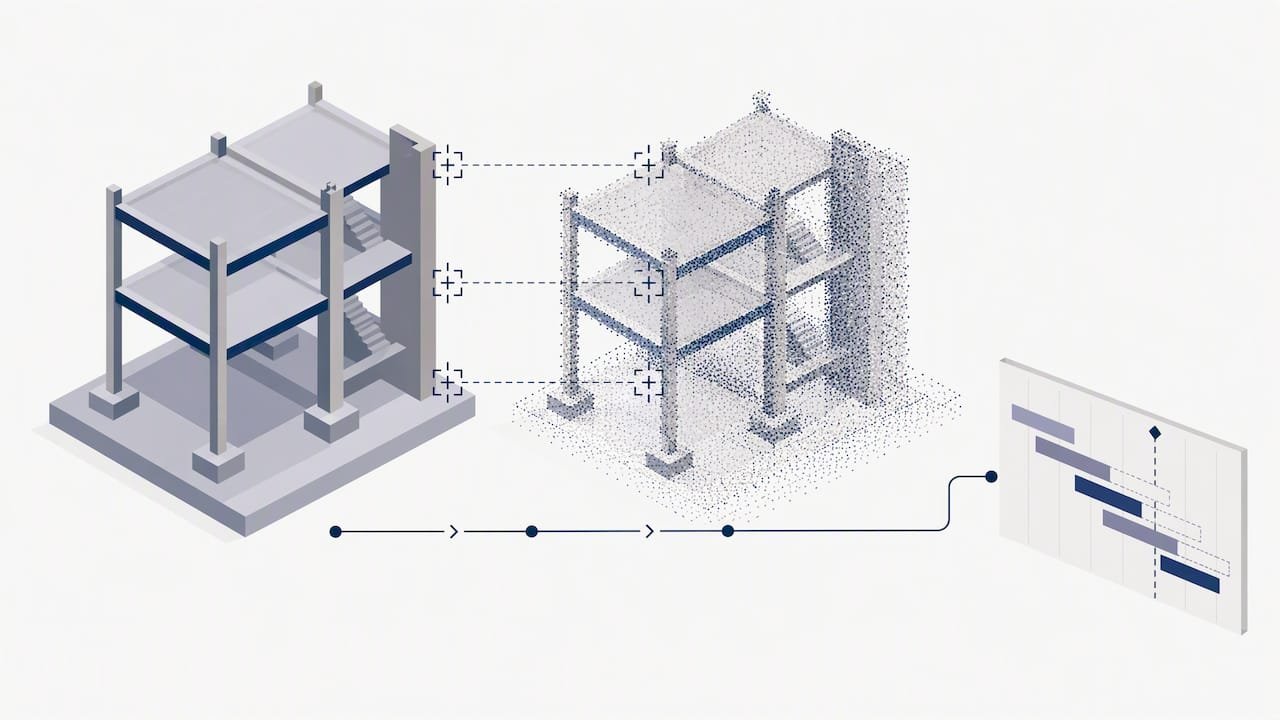
Computer vision adds automated recognition of installed elements from site cameras or drone footage, useful for repetitive, visually distinct work such as formwork, rebar cages or facade panels, but less reliable for finishes or below-ground work where visual cues are weak. IoT sensors on plant and materials add real-time location and utilisation data, strongest for tracking equipment idle time and materials delivery, weaker as a direct proxy for percentage complete.
Key sources and their roles:
- Site logs and supervisor reports: fast and low-cost, but subjective and prone to rounding up.
- Scan-vs-BIM: objective quantity verification, strong for structural and MEP installation, limited by scan frequency and cost.
- Computer vision: good for repetitive visual progress, weak for hidden or finishing work.
- IoT sensors: strong for equipment utilisation, indirect for schedule percent complete.
Pro Tip: Calculate cost percent-complete and schedule percent-complete independently rather than linking one to the other in your reporting tool. Auto-linked calculations hide exactly the divergence between cost and schedule performance that a controls system exists to catch.
A minimal validation rule worth enforcing on any dataset: no progress claim is accepted without a second, independent data source confirming it within an agreed tolerance. Software sits around these inputs rather than replacing them: scheduling tools hold the CPM logic, cost systems hold the PMB and actuals, and BIM platforms hold the model that scan and vision data are checked against.
Setting up and running a project controls plan
A project controls plan is the document that turns the methods above into a repeatable operating routine rather than an ad hoc reporting exercise. It should set out the processes, tools and reporting formats the project will use, and name who is accountable for each.
- Define the roles. The project controller owns the cost and schedule baselines and the integrity of the data behind them. The project manager owns decisions and corrective action. The scheduler and cost lead maintain their respective baselines. An information custodian owns the single source of truth for documents and data.
- Fix the core reports. S-curves showing planned versus earned versus actual value, CPI/SPI trend lines, a top-ten exceptions list and a rolling forecast of out-turn cost and date should appear in every reporting cycle, not just at milestones.
- Set the cadence. Weekly data capture, fortnightly or monthly formal reporting, and a defined escalation path when variance thresholds are breached.
- Keep an audit trail. Every baseline change, forecast revision and risk register update should be logged with a date, a reason and an approver.
ECITB’s guidance on project control careers describes the project controller as the “eyes and ears” of the project manager, a technical discipline requiring competence across estimating, planning, scheduling and cost management rather than a generalist administrative role. That distinction matters for staffing: a controls plan is only as strong as the person accountable for running it.
Where digital twins, probabilistic scheduling and AI are heading
Several advanced techniques have moved from research pilots to early practical adoption over the past couple of years, and they build directly on the methods already covered rather than replacing them.
Digital twins combine a live BIM model with scan or sensor data to create a closed loop between what is happening on site and what the schedule and cost model say should be happening. The ISPRS digital twin research referenced above is one demonstration of this feasibility, connecting observed status directly to forward-looking schedule simulation.
Probabilistic CPM updating applies Bayesian methods to revise the schedule’s probability distribution as new progress data arrives, rather than waiting for a full re-baseline. Combined with AI-driven construction crew scheduling for project managers, this is where some of the clearest measured gains have appeared.
- 4D/5D digital twin integration: links the 4D (time) and 5D (cost) model to live progress data for continuous forecast updates.
- Bayesian schedule updating: revises risk and duration distributions as actual progress data arrives, rather than at fixed milestones.
- AI/deep reinforcement learning (DRL) resource levelling: optimises crew and equipment allocation against live constraints instead of a static plan.
- Human-in-the-loop governance: automated outputs inform decisions, but site safety and professional judgement remain the gate on any schedule change.
A nine-month simulation of an integrated 4D/5D digital twin framework reported significant reductions in estimating labour and overtime, alongside improved forecast traceability, when Bayesian updating and DRL resource levelling were applied, according to research published on arXiv. Those figures come from a simulation-based case study rather than a broad industry survey, so they should be read as an indication of what is achievable under good data conditions rather than a guaranteed outcome.
The prerequisite for all of this is unglamorous: clean, consistent data governance. A digital twin or a DRL resource optimiser trained on inconsistent percent-complete data will simply automate the same bias a manual process already had, faster.
Why project controls fail, and how to catch it early
Most controls failures trace back to a handful of recurring causes rather than anything exotic. Research on cost and time control in construction projects identifies fragmented workflows, late baselines and weak estimating among the most common inhibiting factors, with mitigations falling into preventive, predictive, corrective and organisational categories.
- Fragmented workflows: cost, schedule and risk data living in separate, unreconciled tools. Mitigate with a single integrated reporting cycle and a named data custodian.
- Late baselines: work starting before the PMB is approved. Mitigate by gating mobilisation on baseline sign-off.
- Poor estimating: optimistic durations or costs with no risk allowance. Mitigate with QRA-derived contingency rather than a flat percentage.
- Weak governance: no audit trail or unclear accountability for updates. Mitigate with a documented controls plan and fixed escalation thresholds.
A quick health check: can you name the control account owner, the last baseline approval date and the current CPI/SPI trend without checking three separate systems? If not, the control system needs attention before the next report is due.
What this guide means for how we train project controllers
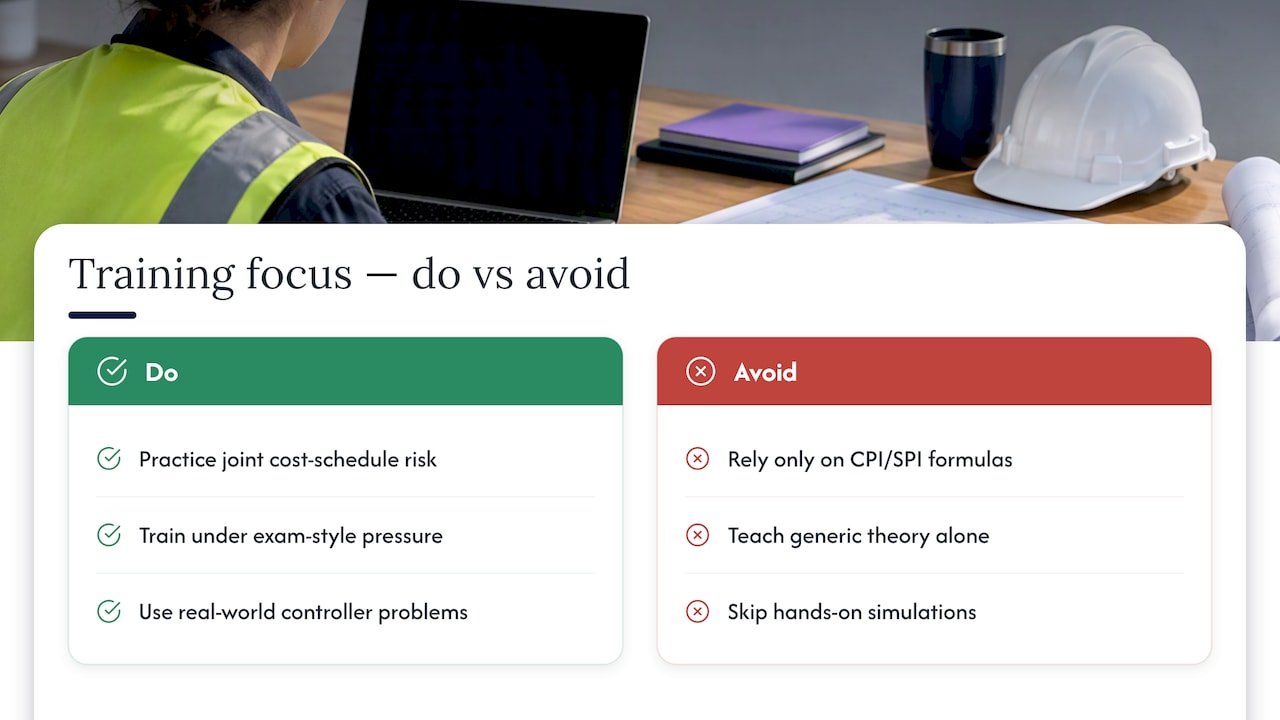
Having worked through how EVM, CPM and quantitative risk analysis combine in practice, the gap I keep seeing on projects is not technique, it is training. Teams often know the formulas for CPI and SPI but have never practised running a joint cost and schedule risk model under exam-style pressure, which is exactly when it matters most.
Our accredited project management courses are built around this gap: delivered in flexible formats, with content shaped to the real-world problems a project controller actually faces rather than generic theory.
— Sam
Build your team’s project controls capability
Reading about EVM, CPM and risk-integrated scheduling is a start, but running them under live project pressure takes structured practice. We offer accredited project management training built around flexible formats, delivered on-site, online or blended to fit how your team actually works.

Browse our course offerings or get in touch to discuss a bespoke corporate programme for your project controls team.
FAQ
What are the six different types of project controls?
Project controls commonly cover scope, time, cost, quality, risk and communication, each with its own baseline, measurement method and reporting line. They are managed together because a change in one, such as a schedule slip, typically affects at least one of the others, most often cost or risk exposure.
What are examples of project controls?
Common examples include a CPM schedule baseline, an earned value management report tracking CPI and SPI, a quantitative risk analysis using Monte Carlo simulation, and a live risk register with named owners and triggers. AACE’s recommended practice on integrated risk analysis treats the combination of these as a single integrated control system, rather than separate reports.
What are the seven stages of a construction project?
Construction projects are generally organised through initiation, planning, design, procurement, construction, commissioning and closeout, though the exact labels vary by organisation and contract type. Project controls activities, particularly baselining and risk analysis, are concentrated in planning and design but continue through to closeout for final variance reporting.
What are the five C’s of project management?
Definitions vary across organisations and training providers, so there is no single agreed list, but versions commonly reference clarity, communication, control, commitment and completion. In a construction controls context, control and communication are the two most directly tied to the methods covered in this guide, such as EVM reporting and stakeholder escalation.
How do I improve project controls on an existing project?
Start by independently calculating cost percent-complete and schedule percent-complete rather than linking one to the other, since that single change often reveals hidden variance immediately. Pairing this with a documented project controls plan and a fixed reporting cadence closes most of the remaining gap.
Sources
- Risk-integrated scheduling for commercial building construction: a BIM and Monte Carlo simulation approach
- Project control careers (ECITB)
- Simulation-based validation of an integrated 4D/5D digital-twin framework for predictive construction control
- Towards a digital twin construction system based on a data-centred approach for construction progress monitoring