Learning data science today is more accessible than ever, even for complete beginners. Whether you’re switching careers, upskilling for a competitive market, or exploring a new interest, the ability to analyse data and communicate insights visually has become one of the most valuable skills in the modern workforce. If you want to learn data science from scratch, 2025 is the perfect year to begin, thanks to improved learning tools, simplified platforms, and clearer training pathways for newcomers.
This guide explains exactly how to start data science learning step by step, how beginners can approach data visualization, which skills you need first, and what a strong learning journey looks like. If you’re feeling overwhelmed or unsure where to begin, this blog will give you the clarity and confidence to move forward.
Why Learn Data Science and Visualization from Scratch Today?
Businesses across every industry are now powered by data. Whether it’s customer behaviour, financial trends, operational performance, or decision-making processes, data supports daily actions at every level. For this reason, the demand for analysts, visualization specialists, and data-driven professionals has grown significantly.
There has never been a better time for beginners because:
- Tools are more user-friendly
- Training programs are beginner-oriented
- AI simplifies complex analytical tasks
- Visual dashboards make analysis easier
- Employers value practical ability over academic degrees
This makes no-experience data science training not only possible but highly achievable with the right structure and mindset.
Understanding the Fundamentals: Data Science Basics for Newcomers
If you’re starting fresh, you must first understand the foundation of data science. Most beginners struggle because they try to learn too many advanced subjects too quickly. Instead, focus on data science basics for newcomers, such as:
1. What is Data Science?
Data science involves collecting, cleaning, analysing, and interpreting data to answer questions or solve problems.
2. Core Components of Data Science
- Data analysis
- Statistics
- Programming
- Visualization
- Storytelling
- Machine learning (later stage)
3. Tools Used by Beginners
- Python
- SQL
- Excel
- Tableau or Power BI for visualization
These basics prepare you for more advanced concepts once you’re ready.
How to Start Data Science Learning – A Simple Approach for Beginners
Beginning your journey can feel overwhelming, but breaking it into simple stages can make the process manageable. If you want to understand how to start data science learning, follow these structured steps:
Step 1: Learn Basic Computer and Analytical Skills
You don’t need to be a programmer to begin. Focus first on understanding logic, data structures, and simple analytics.
Step 2: Learn Basic Statistics
Concepts like mean, median, standard deviation, distributions, and correlations are essential.
Step 3: Start Learning Python
Python is beginner-friendly and widely used in data science. Begin with:
- Variables
- Loops
- Functions
- Lists and dictionaries
- Libraries such as Pandas and NumPy
Step 4: Explore Real Datasets
Hands-on practice builds confidence. You can find beginner datasets on:
- Kaggle
- Google Dataset Search
- Government open data portals
Step 5: Apply Skills to Small Projects
This is where confidence grows. Simple projects could include:
- Analysing movie ratings
- Creating a sales dashboard
- Exploring COVID-19 data trends
This structure makes step-by-step data science learning clear and achievable for anyone.
Starting Data Analytics for Beginners – What You Need to Know
When you begin starting data analytics for beginners, the main goal is not mastering advanced algorithms but understanding how to explore data logically.
A beginner should learn:
- How to ask analytical questions
- How to summarise data
- How to clean messy datasets
- How to detect trends or anomalies
- How to create charts and graphs
These early steps build the foundation for deeper data science studies.
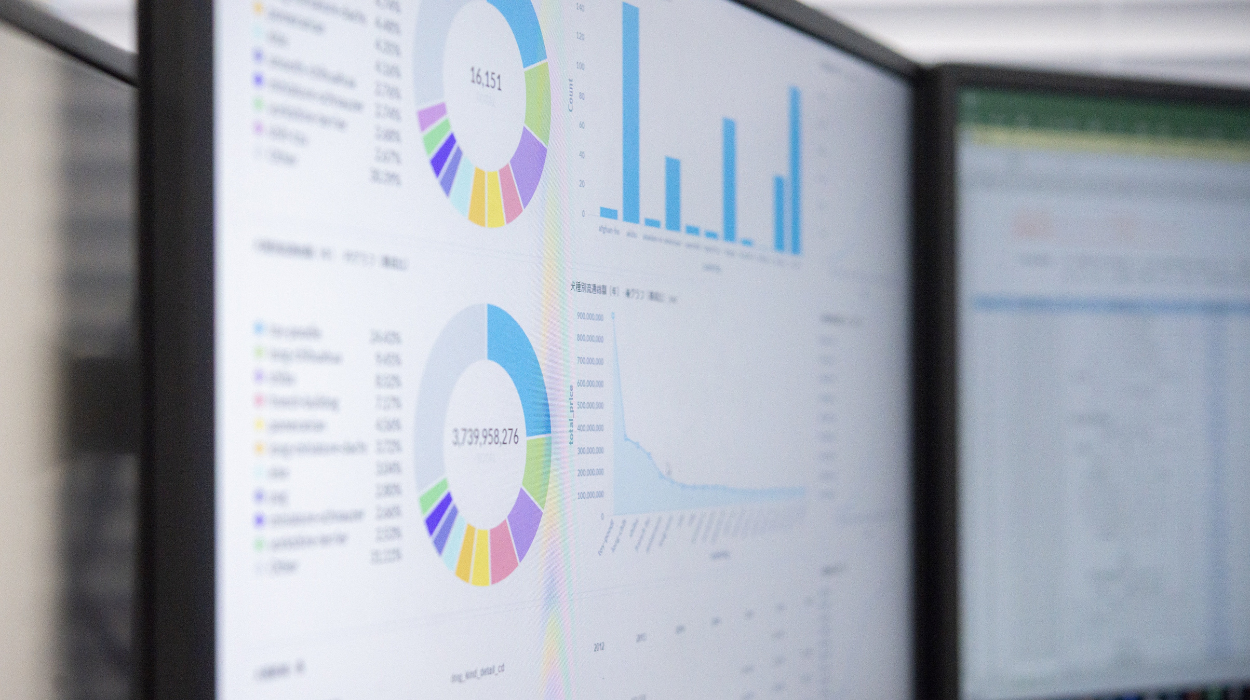
How to Learn Data Visualization from Zero: A Beginner’s Roadmap
Data visualization is just as important as analysis. Knowing how to create charts that communicate insights clearly is essential for telling meaningful stories through data.
If you’re exploring how to learn data visualization from zero, focus on these fundamentals:
Start with Simple Charts
- Bar charts
- Line graphs
- Scatter plots
- Pie charts (use sparingly)
Learn Visualization Tools
Beginners should try:
- Power BI
- Tableau
- Google Looker Studio
- Python visualization libraries (Matplotlib, Seaborn)
Focus on Design Principles
Good visualization requires clarity. Learn:
- Colour usage
- Labeling
- Avoiding clutter
- Highlighting insights
Build Mini Dashboards
Create dashboards that tell a story such as:
- Sales performance
- Market trends
- User engagement
Visualization is about communication; you don’t need artistic skills to become effective.
Beginner-Friendly Data Science Resources to Get Started
To support your journey further, here are some beginner-friendly data science resources:
Free Resources
- YouTube tutorials
- Kaggle Learn
- Google Analytics Academy
- Microsoft Learn for Power BI
Paid Beginner Programs
- Structured beginner bootcamps
- Instructor-led training with live sessions
- Certification programs
- Online platforms with guided learning paths
Practice Resources
- Kaggle competitions
- GitHub beginner projects
- Public dataset libraries
- Practice quizzes and coding exercises
Using beginner-oriented content ensures you learn at your own pace without unnecessary pressure.
Why Visualization Matters for Absolute Beginners
Visualization helps beginners understand data concepts faster. It translates numbers into visual meaning, making complex ideas easier to digest.
Key benefits include:
- Faster learning
- Better interpretation of insights
- Improved analytical thinking
- Stronger communication skills
For this reason, data science and visualization should be learned together rather than separately.
Data Science Learning Path for Starters – A 10-Week Roadmap
If you prefer structure, here is a complete data science learning path for starters:
Week 1–2: Basic Concepts
Understand data types, statistics, and introductory analytics.
Week 3–4: Python Foundations
Learn basic programming and data structures.
Week 5–6: Data Cleaning and Analysis
Explore datasets, treat missing data, and run simple analyses.
Week 7: Visualization Basics
Learn chart creation and visual storytelling.
Week 8: Power BI or Tableau
Build dashboards and visual reports.
Week 9: Beginner Projects
Combine analysis and visualization to create small portfolio projects.
Week 10: Review and Strengthen Weak Areas
Revisit unclear concepts and refine your skills.
This structured approach ensures progress, clarity, and practical learning.
Common Myths About Learning Data Science from Scratch
Beginners often face misinformation, so let’s break common myths:
Myth 1: You must be good at maths
Basic math is enough to start.
Myth 2: You need years of experience
Many professionals enter the field from non-technical backgrounds.
Myth 3: Programming is too difficult
Python is one of the easiest languages for beginners.
Myth 4: Visualization requires design talent
Visualization is more about logic and clarity, not artistry.
Final Thoughts
Starting from zero is not a limitation—it is a strength. Anyone can learn data science with the right roadmap, tools, and mindset. This guide provides everything you need to learn data science from scratch and build skills step by step. As the demand grows in 2025 and beyond, having a solid foundation in analytics and visualization will open powerful career opportunities.
Institutions like Oxford Training Centre offer structured Data Science and Visualization Training Courses designed specifically for beginners. With expert guidance, hands-on learning, and real-world practice, you can build confidence and develop the analytical capabilities needed to grow in a data-driven world.